Excel got the array. It did not get the dimension.
AI & Finance
Impromptu
Finance
Excel
Teaching
Dynamic arrays and LAMBDA have turned Excel into a functional programming environment, and a serious literature now argues that this hands modelers everything the multidimensional tools had without giving up the familiar interface. Most of the technical claims hold up. The conclusion does not. The way to show that is to design the Excel workbook the position requires, and see where the wall stands.
An analysis note, not an episode. It has two starting points. One is historical: the line of tools from Javelin through Trapeze to Lotus Improv, which kept formulas out of the cells, and a claim, now made by careful people, that modern Excel has caught up with them. The other is practical. On this bench I build fundamental corporate-finance models in Impromptu, a leveraged buyout and its valuation among them, and I wanted to know what it takes to build the same models in Excel. The note takes the strongest published form of the claim seriously and then designs the Excel workbook it requires. A small demo workbook, one sheet per layer of the design, can be downloaded from section 10. Technical terms are collected in the Glossary.
1. The spreadsheet as graph paper
A spreadsheet is a very large sheet of graph paper. Each square holds one value or one formula, and it is addressed by a column letter and a row number. Most of what a finance professional builds fits on it comfortably. A financial statement is a column of line items against a row of years; a schedule is a smaller block beside it; a chart is drawn from a rectangle of squares.
The paper takes any shape, provided the shape lies flat. A model with three dimensions, line items by years by scenarios, has to be flattened before it goes on the sheet. The third dimension becomes pages, one sheet per scenario, or blocks stacked down one sheet, one block per scenario. What the grid cannot hold is the object itself. Piero della Francesca drew three-dimensional space in perspective on a flat panel; a spreadsheet stays a table, and a table is not a painting. Every layer of the design in section 6 comes back to this, and the scenario axis of a leveraged-buyout model is where it costs most (Layer 6).
The paper also has a property the multidimensional tools do not share. In Excel everything is in a cell, and a cell holds a value. The labels that play the part of a dimension, the years across the top and the line items down the side, are cells like any other. A year can be a number or a date, generated with SEQUENCE or EOMONTH, compared, added to and formatted. In a multidimensional tool a coordinate belongs to the structure rather than to the data, and a formula refers to it as a coordinate. In Impromptu, as in Quantrix, coordinates are text: the year 2027 is the name “2027”, and a formula that wants to compute with it has to convert it first, with value() or datevalue(), a conversion that often fails. Excel does not separate structure from data, and for a modeler that is a real convenience. The rest of this note is about what the separation buys, and what its absence costs.
2. What changed in the formula language
For most of its history an Excel formula returned one value into one cell. A line item across sixty months was sixty formulas, written once and copied to the right. Since 2020 that is no longer the only way to work. Four additions make the difference, and each is shown here on a small example. The demo workbook of section 10 contains all of them.
Dynamic arrays and spilled ranges
A dynamic array formula returns more than one value. You type it in one cell, and Excel writes the results into the neighbouring cells as well. This is called spilling, and the block of cells it fills is the spilled range. Only the first cell, the anchor, holds the formula; the other cells hold its values. Typed in B2,
B2: =SEQUENCE(1, 5, 2023)fills B2:F2 with the five years 2023 to 2027: one row, five columns, starting at 2023. If the formula later returns more or fewer values, the range grows or shrinks with it. If a cell in the way is not empty, the anchor shows #SPILL! instead. A spilled range is referred to by its anchor followed by #: B2# means whatever B2 currently spills.
Arithmetic works on whole ranges at once. With a base revenue in A3 and a growth rate in B1,
B3: =A3 * (1 + B1) ^ (B2# - 2023)writes the revenue for all five years from one formula. The same mechanism powers a set of list functions: SORT, UNIQUE and FILTER return a sorted, de-duplicated or filtered copy of a range. Excel had array formulas before, entered with Ctrl+Shift+Enter, but they had to be given their output range in advance. A dynamic array sizes itself.
Naming intermediate results with LET
LET gives names to intermediate results inside one formula and then computes an expression that uses them:
B3:   =LET(base, A3, g, B1, t, B2# - 2023,
           base * (1 + g) ^ t)
This computes the same row as before, and it reads as a definition. The names exist only inside that one formula.
Functions you define: LAMBDA
LAMBDA defines a function inside a formula. The last argument is the calculation; the arguments before it are the parameters. Written in a cell, =LAMBDA(base, g, t, base * (1 + g) ^ t)(A3, B1, B2# - 2023) defines the function and calls it at once, which is only a curiosity. The useful step is the Name Manager (Formulas ▸ Name Manager), where any formula can be given a name. Give the name Grow to
Grow =LAMBDA(base, g, t, base * (1 + g) ^ t)and =Grow(A3, B1, B2# - 2023) works in every cell of the workbook, like a built-in function. Before LAMBDA, a function of your own had to be written in VBA, Excel’s macro language, and the workbook saved as a macro-enabled file, which many organisations restrict.
Functional programming, in a formula
Functional programming is a way of writing programs as functions that take values and return values without changing anything outside themselves, and in which a function is itself a value that can be handed to another function. Excel formulas already had the first property: a formula reads its inputs and returns a result, and it cannot write into another cell. LAMBDA supplies the second, and a family of functions that take a LAMBDA as an argument puts it to work:
MAPapplies a function to every element of a range.BYROWandBYCOLapply it to every row or every column.SCANwalks through a range carrying a running value, the accumulator, and returns the accumulator after every step.REDUCEmakes the same walk and returns only the final accumulator.MAKEARRAYbuilds an array of a given size from a function of the row and column number.
SCAN matters most for a financial model, because it is a loop. A loan repaid over five years, with the opening balance in A6 and the five repayments in B5:F5:
B6: =SCAN(A6, B5:F5, LAMBDA(balance, repayment, balance - repayment))spills the five closing balances. The function is applied once per year, and each time balance holds the result of the year before. A modeler used to write this as a row of copied formulas, and a programmer as a for loop. A named LAMBDA can also call itself, so a recursive definition is possible, up to a depth limit set by Excel.
What this adds up to
A function of your own, a loop that carries a balance from one period to the next, sorting, filtering and grouping a table: each of these once needed VBA, or an export to Python or another language. Each can now be written in worksheet formulas, in an ordinary .xlsx file with no macros. It needs a recent Excel: LAMBDA and its helpers need Microsoft 365 or Excel 2024, and the grouping functions GROUPBY and PIVOTBY need Microsoft 365. The rest of this note asks how far this takes Excel toward the multidimensional tools, and what it costs to get there.
3. The claim on the table
There is a position, now held by a good number of thoughtful people, that goes roughly like this. As section 2 showed, Excel’s calculation engine was rebuilt to support dynamic arrays, LET and LAMBDA; the result is that the spreadsheet has quietly become a functional programming environment, in which a model can be written as a sequence of named formulas over whole line items rather than as a field of copied cells. The techniques the multidimensional modelers were invented to provide are therefore available now, in the application everyone already has, without the migration.
There are three statements of that position and they are not equally careful, nor equally interested. I want to engage the strongest one, so it is worth separating them.
The refereed version, selling nothing. Peter Bartholomew has argued it across three EuSpRIG papers. In 2016, that named formulas can replace nested formulas and turn a worksheet into something resembling a sequence of programming statements. In 2019, that dynamic arrays might finally change how models are built: “a major advantage of fully dynamic models is that they require less manual intervention to keep them updated and so have the potential to reduce the attendant errors and risk”. And in 2023, that Excel is now a Turing-complete functional programming environment, in which “the ad-hoc end user practices of traditional spreadsheets” can be replaced by “radically different approaches that have far more in common with formal programming.” This is the version with no product attached, and it is the one I take most seriously.
The engineering version. Craig Hatmaker is a Microsoft MVP and the founder of Beyond Excel and of the 5g modeling standard. He made the case at the same 2023 conference, under the title Reducing Errors in Excel Models with Component-Based Software Engineering. Model errors are pervasive and can be catastrophic; LAMBDA lets you assemble a model from pre-built, pre-tested components instead of writing formulas from scratch; junior modelers therefore build faster and more accurately. That is a real software-engineering thesis and I treat it as one. Where it fails is the governance layer, and the place is specific.
The popular version. The same argument, aimed at practitioners, appears in LAMBDA — The New Excel Paradigm for Modeling (March 2024), published by the Melbourne consultancy Model Citizn with Hatmaker. It runs in four moves. Spreadsheet models are untrustworthy and everyone knows it: “a general lack of structure and design through a history of nasty habits which translate into errors, and complexity and push many to shun Excel altogether.” That shunning was never justified: “the cry for the death of Excel has been fake news even before fake news was a thing… driven for the most part by software companies trying to sell their ‘Excel killer’ app.” Microsoft has fixed the underlying problem, because “the dynamic array’s spill region contains results, not formulas. Spill ranges cannot have inconsistent formulas because there are no formulas”, and because “a five-year monthly template can, with the change of two input cells, become a ten-year annual template with no formula changes.” And LAMBDA is hard, so you should not have to write it: that is what a library like 5g is for, and “5g functions use LAMBDA but modelers need not know anything about LAMBDA.” The piece closes on the Matrix image of a junior modeler downloading Kung Fu, and on the choice between the blue pill and the red pill.
Two clarifications, so that what follows argues against the real position rather than a convenient one.
None of them names the tools I am about to name. Trapeze, Javelin, Lotus Improv and Quantrix appear in none of the four texts. The claim about alternatives is made once, in the popular piece, in general and in passing: “Excel killer” apps are what vendors sell, and their obituary for Excel was fake news. The stronger reading, that these features now give you the best of both worlds and the alternatives are therefore moot, is an inference rather than a quotation. It is a fair inference, I think, and it is the one the literature is built to leave you with. But it is mine, and I will argue it as mine.
This is not a bolt-on marketing idea. LAMBDA descends from a 2003 ICFP paper by Simon Peyton Jones, Margaret Burnett and Alan Blackwell, A user-centred approach to functions in Excel, and from two decades of the Calc Intelligence programme at Microsoft Research. When Andy Gordon and Peyton Jones announced LAMBDA they described the goal explicitly as making Excel’s formula language “a full-fledged programming language.” The ambition is real, it is long-standing, and it is Microsoft’s own.
4. Where the position is right, and it is not a small thing
The technical core is correct, and it is the most important change to Excel in thirty years. It gets its full weight here, before anything is taken away.
A dynamic array formula is an array-level formula. You write one expression, in one cell, and it produces a whole row, column or block of results. That is the central idea of the multidimensional tradition, one rule per line item rather than one formula per cell, and it now runs in the application that is already installed on every desk in finance.
The consequence they name is real and it is the right one to name. If a five-year monthly revenue line is one formula spilling across sixty periods, then the class of error that has dominated spreadsheet risk for forty years is gone by construction: the formula in column AK is not the formula in column AJ. It is not reduced by discipline or detected by an audit add-in. There is nothing in column AK to be wrong.
This is not a fringe assessment. The ICAEW rewrote its Twenty principles for good spreadsheet practice in 2024 specifically to account for the new engine, noting that dynamic array formulas “can reduce the number of different formulas required and enforce the consistency of a formula across a range.” When a professional body revises its guidance, the change is real.
LAMBDA really does close the gap that was left. Financial models are full of recurrences: closing balance equals opening balance plus additions minus disposals, and the next period’s opening is this period’s closing. Spilled arrays compute a whole row at once, which is exactly the wrong shape for a calculation that has to walk forward one step at a time. Before LAMBDA, SCAN and REDUCE, you either broke the spill into a corkscrew block of ordinary cells, reintroducing the per-cell paradigm you were trying to escape, or you reached for VBA. Now you can express the recurrence itself. That is a genuine advance, and they are right that it was the blocker.
The component libraries are real engineering. Named, documented, tested functions built from formulas rather than macros, given away with the source visible, are a serious contribution to a community that badly needed one, and the argument for them was made properly, at a conference, not only in a brochure. The complaint I will make later is about the infrastructure the argument assumes, not about whether the functions work.
And the direction of travel is genuinely toward the older tradition. Bartholomew’s programme is names instead of addresses, formulas that read like statements, calculation blocks that resize themselves. That is the Improv instinct rediscovered from inside the grid, by someone who did not need to be told about Improv to arrive there. The convergence is evidence for the position, not against it.
The parts of the technical claim about dynamic arrays and LAMBDA are honest and mostly proven. Where I part company is the step that is never stated as a claim and therefore never defended: that this closes the distance to the multidimensional tools. It closes one of the distances that tradition opened. The next section names all of them, and the rest of this note is about the others.
5. What those tools actually did
The lineage is older than most people assume and it was never really about arrays.
Javelin (1985) treated time series and tables as objects rather than as collections of cells. Trapeze (1987) introduced named formulas over named blocks. Lotus Improv (1991, on NeXTSTEP) brought the pieces together and stated the idea cleanly: the cells hold only input and output data, while formulas live outside them, written over names. Monthly figures were grouped into “1995” and “1996” and the category was called years; dragging the category tabs re-pivoted the whole report; the formulas were unaffected, because they had never referred to a position in the first place.
Strip that down to properties a workbook can either have or not have:
| The property | |
|---|---|
| P1 | One rule per line. A formula is attached to a whole line item, not copied across cells. |
| P2 | Formulas live outside the grid. They are objects you can list, read, name and edit in one place, rather than contents hidden inside cells. |
| P3 | Labels are addresses. “The 2027 column of Gross Margin” is what the formula literally says, and the engine resolves it. Not a lookup the modeler wired up by hand. |
| P4 | Dimensions are named and there can be many. Years × products × scenarios × entities coexist in one object; the screen shows a projection of it. |
| P5 | Layout is a view. Re-pivoting, transposing, collapsing a dimension changes nothing about the model. |
| P6 | Extension is automatic. Add a product to the products dimension and every rule that spans products covers it, at once, everywhere. |
P1 is the one modern Excel bought. Everything in section 3 is a well-argued case for P1. What it costs to buy the rest, and whether the receipt is worth it, is the rest of this note.
6. The design exercise: assembling Improv out of modern Excel
This is the part I actually care about. The question is not whether Excel can do it in the lawyerly sense, since Excel is Turing-complete and of course it can. The question is what the workbook looks like, what the modeler has to hold in their head, and what breaks first.
I will build it in nine layers, numbered from zero. Everything here is native Microsoft 365 Excel; none of it needs an add-in, though two layers are much better with one.
Layer 0, data goes into Tables, never into the grid
Every input lives in an Excel Table (Ctrl+T), not in a rectangle of cells. This buys the first sliver of P3: structured references are names. Assumptions[Growth] instead of $B$7. Tables also auto-extend, which is the first sliver of P6: add a row and formulas that reference the column see it.
This is old advice, and much older than LAMBDA. The Operis approach to financial modeling has for decades named everything so that formulas “read like sentences,” and Bartholomew’s 2016 paper is an argument that named formulas, not named ranges, are what make a workbook legible. It remains the highest-yield habit in Excel. But note what kind of name it is: a column name inside one table. It is not a dimension. There is no object called product that several line items share.
Layer 1, the timeline is generated, and it is the only thing that is
One cell produces the whole period axis:
PeriodEnd: =EOMONTH(StartDate, SEQUENCE(1, Periods, 0, 1))Change Periods from 60 to 10 and the step from 1 month to 12, and the axis reshapes. This is the mechanism behind “five-year monthly becomes ten-year annual with two cell changes,” and within the calculation block it is true.
It is worth being precise about what “with no formula changes” covers, because the sentence does a lot of work. The spilled calculations follow, genuinely. What does not follow: number formats and column widths, the print area, conditional formatting rules bound to ranges, any chart whose series were defined against fixed ranges, anything downstream that was not itself written as a dynamic array, and any input table whose rows were keyed by month. A model built end-to-end in this style resizes beautifully. A model that is 80% in this style resizes into a mess, and 80% is what real workbooks look like six months in.
Layer 2, one spill per line item, named
Each line item is exactly one formula in one anchor cell:
Revenue:   =LET(
             base, Assumptions[Revenue Y0],
             g,    Assumptions[Growth],
             base * (1 + g)^SEQUENCE(1, Periods, 0, 1)
           )
Then, in the Name Manager, define Revenue as =Model!$C$10#. The # is the spilled-range operator: it means whatever this spill currently is, however it grows. Now downstream lines read like this:
Gross:     =Revenue - COGS
EBITDA:    =Gross - Opex
=Revenue - COGS is not a metaphor for an array-level formula. It is one: named operands, whole line items, no addresses, no fill-right, correct at any length. That is P1 achieved, and a slice of P2 as well, since the formula text is in a cell rather than in a formula list but there is exactly one of it and you can find it.
Layer 3, reusable rules become named LAMBDAs
When the same shape of logic recurs, it is lifted into a named function in the Name Manager:
Growλ =LAMBDA(base, rate, n, base * (1 + rate)^SEQUENCE(1, n, 0, 1))and used as =Growλ(Assumptions[Revenue Y0], Assumptions[Growth], Periods).
One level up sits the question of where such functions come from, and there are several answers in circulation. You can write and curate them yourself, which is what Bartholomew’s papers describe. You can import a published library: 5g’s Timelineλ, Corkscrewλ, Movementλ and Depreciateλ are the best-known set, and there are others, including the worked collections in Liam Bastick’s Financial Modelling using Dynamic Arrays. Or you can take the patterns from any of these and recode them into your own model, which is what I would do in a teaching setting and what the workbooks described in section 10 do.
I am deliberately not ranking these. The library question is orthogonal to the paradigm question, and I have no evidence that any particular packaging is best practice. What I can say is that the pattern is common to all of them, and that its existence as a packaged artefact is itself the interesting datum. Nobody ships a Subtractλ.
Two things at this layer go undiscussed in all four sources. LAMBDA turns Excel into a pure functional language with first-class functions and lexical scope, which is a real programming language with real programming problems. And the moment your model depends on named functions, editing them in the Name Manager’s single-line box becomes untenable. The intended answer is Excel Labs, the Microsoft Garage add-in that absorbed the Advanced Formula Environment, which gives you syntax highlighting, multi-line editing and comments. It is a preview add-in, and its own page says preview features may change or be discontinued. There is no equivalent outside Excel: the request for a VS Code extension has been open on Microsoft’s own repository since the tool was released. And on a managed corporate or university install, which is the environment most of finance actually works in, you may simply not be permitted to install an add-in at all. In that case the IDE for your functional programming language is a one-line text box.
Layer 4, recurrences, and the first real wall
The roll-forward. SCAN handles the simple case cleanly:
ClosingDebt: =SCAN(OpeningDebt, Repayments, LAMBDA(bal, rep, bal - rep))One formula, whole row, correct at any length.
Now make it a real corkscrew, where each period must report opening, draws, repayments and closing. The natural functional move is to accumulate a small block per period and stack it, and that is where Excel stops. In Excel as it ships today a value cannot itself be an array, so the canonical formulation
=SCAN({1}, {2,3,4}, LAMBDA(acc, cv, VSTACK(acc, cv)))returns a #CALC! error. This is starting to change. Since 24 September 2026 Microsoft’s Beta channel has previewed nested arrays: in a workbook switched to Compatibility Version 3, the same formula returns three cells, each holding an array. It is a preview, and this part of Excel is still moving. The rest of this layer describes Excel as it ships today.
The community’s answer is thunks: you wrap each intermediate array in a zero-argument LAMBDA, so that the accumulator holds functions, which are legal values, instead of arrays, which are not. You then unwrap and recombine them pairwise, often as a binary tree, for performance. It works. It is also lambda calculus deployed to smuggle a data structure past a type restriction, in a spreadsheet, by finance professionals.
That is the honest shape of the LAMBDA era. Corkscrewλ() exists because doing a corkscrew in a dynamic array is hard enough to need a library. The library is a real solution. But the difficulty it hides is not incidental complexity that Microsoft will polish away next year. It comes from a grid that can hold two dimensions and a calculation engine that will not let a value be an array. In a tool where the engine knows your data has a time dimension, a corkscrew is not a special case at all: the previous period is a coordinate, so “opening balance = previous closing” is one rule with a positional operator in it, and the four lines of the corkscrew are four ordinary line items over the same axis. There is no recursion to write, no accumulator to carry and nothing to thunk.
Layer 5, circularity, and the loop you write yourself
Interest depends on debt. Debt depends on the cash flow available to repay it. Cash flow depends on net income. Net income depends on interest. In a model that charges interest on the year’s average balance, this year’s interest reads this year’s closing balance, and that balance includes this year’s interest. No order of calculation computes every line after the lines it reads.
Not every leveraged model has the loop, because modelers usually take it out by hand. The model of episode one and episode two does not have it: traced line item by line item and year by year, it has no cycle, and its Excel reproduction needed no fixed point. Episode 3 keeps the loop on purpose, and the next post reproduces that model in Excel.
The classical Excel answer is to switch on iterative calculation and let the workbook settle. It is a blunt instrument: a fixed iteration count, a stop rule on the largest change between two iterations, no convergence report, and most modeling standards tell you to avoid it.
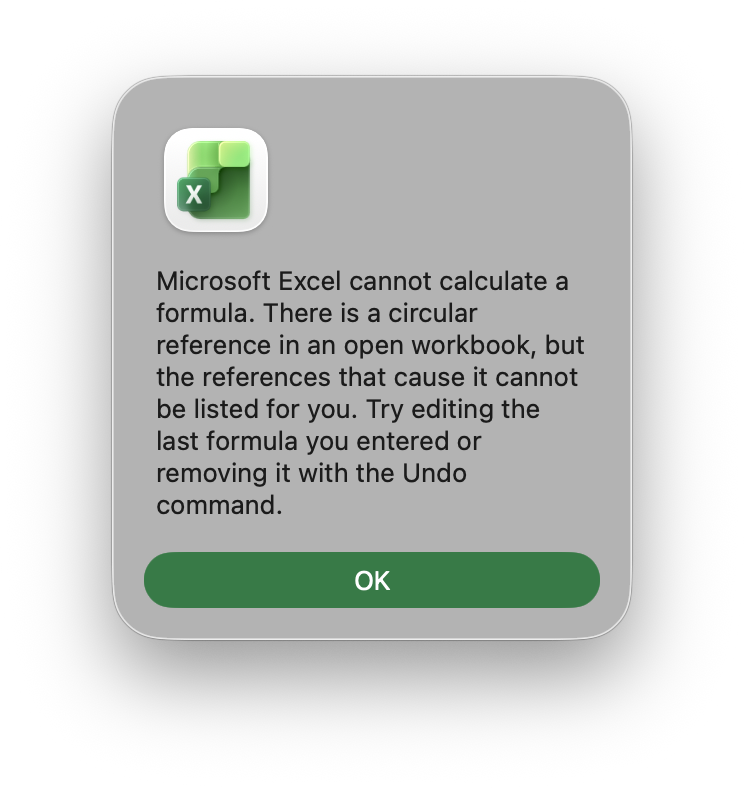
I expected a spilled range to be unable to take part in a circular reference at all. Building the next post’s workbook on Excel 16.114 for Mac (Beta channel) showed two things instead. Written the obvious way, one spilled formula per line item, the loop produces a dialog that cannot name the cells in it (Figure 2), and then every cell in the loop, and every cell downstream of it, computes as 0. No cell shows an error value. And iterative calculation does reach spilled ranges. Switched on, it converges, but it is a setting of the application rather than of the workbook, and on that model it stops short of the precision the workbook’s own checks require.
Three options remain. Break the loop algebraically, and change the economics. Keep the circular part as ordinary cells, abandoning the paradigm precisely where the model is hardest. Or write the fixed point yourself: a REDUCE that applies the whole model, as a function, to its own previous output until the change falls below a tolerance.
The third is the one the next post builds, on the leveraged-buyout model of Episode 3, and the demo workbook of section 10 has a small example. It amounts to writing, in the formula language, part of the calculation engine that a multidimensional tool runs on the modeler’s behalf.
Layer 6, the third dimension, and the choice you cannot avoid
Now add products. Revenue by period and product, in a model that also runs three scenarios.
The grid gives you two axes, so something has to give. There are three honest options and you must pick one.
Long format. One tidy table with columns scenario | product | period | line | value, computed with MAKEARRAY or by stacking, then projected into readable reports with the aggregation functions Microsoft shipped in 2024, GROUPBY and PIVOTBY.
This is the closest Excel comes to P4 and P5, and it is genuinely close: one fact table, many views, change the arguments and the report re-pivots. The cost is that the thing you compute in and the thing you read are now different objects, and the modeler maintains the mapping between them. Improv’s point was that they are the same object.
Stacked blocks. One spill per product, stacked down the sheet, aggregated with VSTACK/HSTACK and BYROW. Readable. Extends by copy-paste, which is precisely the operation P6 exists to eliminate.
Sheets as the third axis. One sheet per scenario. Excel has 3-D references (=SUM(Sheet1:Sheet3!B4)) but they are a narrow legacy facility, they do not compose with dynamic arrays, and a sheet name is not a coordinate you can aggregate over, filter by, or write a formula across. This is not a dimension; it is a filing convention.
The reproduction of episodes one and two takes the second option for its scenario axis: one block per scenario, emitted by a build step rather than copied by hand. That makes the price countable. The second scenario re-emits the names of 118 line items, each of which is one object in the reference model. The next post measures what a third scenario costs.
There is a fourth path worth naming honestly, because it is the one that actually has dimensions: Power Pivot and DAX. The Excel Data Model is a genuine multidimensional engine, with named dimension tables and named measures defined once and pivoted freely, satisfying P2 through P5 largely. It is the Improv idea, shipped inside Excel, for well over a decade. And essentially no financial modeler builds a forecast in it, because it is an aggregation engine over facts that already exist: no cell-level input, no roll-forwards expressed naturally, no circularity, and a second formula language with different semantics that you must learn in full. Excel already contains the answer, in a compartment that does not connect to the room where forecasts are built. The disconnection is the finding.
Layer 7, governance, or component engineering without components
This is where I think the strongest version of the position actually fails, so it gets the argument in its own terms.
Hatmaker’s EuSpRIG paper proposes component-based software engineering for Excel: assemble models from pre-built, pre-tested components rather than writing formulas from scratch. As a diagnosis this is right, and the analogy is well chosen, because CBSE is exactly what the software industry did about the same problem. But CBSE is an infrastructure rather than a habit: a registry, a version identifier on every component, a manifest in which a consumer declares what it requires, a resolver that satisfies those requirements, and a distribution channel that can push a fix. Maven, npm, NuGet, Cargo. The discipline is the visible part; the machinery is what makes it work.
Excel provides none of it. Names are saved in the workbook, not in Excel. Sharing means copying names, or copying a sheet that carries them, into each file. So: forty models use Corkscrewλ. You find a bug in it. There are now forty copies, of unknown vintage, and no way to ask a workbook which version it holds. Two files that look identical can return different numbers because one holds a repaired Depreciateλ and the other does not, and nothing on screen tells you. Delete a name and every formula using it becomes #NAME?. There is no version, no manifest, no resolver and no channel, which are the four things CBSE is made of.
You can mitigate this, and it is instructive to see how far you have to go. Excel Labs will round-trip named formulas as text, so you can keep the canonical library in a Git repository and paste it in by hand. If you cannot install Excel Labs, you can go further and write the names into the .xlsx from outside Excel entirely. The file is a zip, defined names live in xl/workbook.xml, and a LAMBDA is stored there as _xlfn.LAMBDA with every parameter prefixed _xlpm., both of which Excel strips on display. XlsxWriter documents the technique. So you can have a source-controlled library with a real build step and real diffs.
To get component engineering into a spreadsheet, you wrote a compiler that lives outside the spreadsheet. The paradigm now depends on tooling that Excel does not supply, that no vendor supports, and that the modeler who “need not know anything about LAMBDA” certainly cannot maintain. VBA had all of these problems in 1997, and they are a large part of what drove people away from it.
Layer 8, the audit story you have to write yourself
The final layer is the one nobody sells. You have replaced sixty auditable cells with one 400-character LET containing three nested LAMBDAs. When the answer is wrong by 3.7%, you need to find out why.
Excel’s audit tooling is trace precedents, evaluate formula and F9 on a fragment, and it was designed for a paradigm where intermediate results are visible in cells. In a spilled functional model the intermediates are LET bindings that exist for microseconds inside one cell. There is no step debugger, no breakpoint, no watch window over a REDUCE accumulator, no way to see iteration 34 of 60. The practical technique is to copy the formula into empty cells and dismantle it by hand, rebuilding the very intermediate cells the design set out to remove.
7. The scorecard
| Property | Modern Excel | How | |
|---|---|---|---|
| P1 | One rule per line | yes | dynamic arrays, honestly and fully |
| P2 | Formulas outside the grid | partly | one formula per line item, but inside a cell; named LAMBDAs are outside, in a box with no editor |
| P3 | Labels are addresses | no | headers are adjacent decoration; any label→position mapping is XMATCH written and maintained by the modeler; the labels are values, which is an advantage (section 1) |
| P4 | Many named dimensions | no in the grid; yes in a compartment | two axes plus workarounds; the Data Model has real dimensions but cannot host a forecast |
| P5 | Layout is a view | no | orientation is compiled into the formulas: SEQUENCE(1,n) spills right, SEQUENCE(n,1) spills down, and transposing a model means rewriting it |
| P6 | Extension is automatic | partly | automatic along a generated axis; manual along every axis you had to fake |
Circularity is not in the table because it was never one of the six properties, and Improv did not solve it either. I include it because it is where the new paradigm fails most quietly: written the obvious way, a circular spill computes to zeros after one dialog, and the working answer is a fixed point the modeler writes (Layer 5).
P1 is the big one and Excel has it. What P3 costs is the load-bearing failure.
In Impromptu I write Plan[Gross margin, 2027] and the engine resolves both labels against the dataset’s own dimensions. If “Gross margin” is not a line in Plan, that is an error, immediately, at the point of writing. In Excel the same idea is:
=INDEX(Plan, XMATCH("Gross margin", LineLabels), XMATCH(2027, YearLabels))which works, and which nothing checks. LineLabels is a range that happens to sit beside Plan and happens to be in the same order. Insert a row in one and not the other and every formula keeps calculating, silently, against the wrong line. The labels never were addresses; they are a parallel structure the modeler maintains by hand.
The year in that formula is a number, and YearLabels can be generated with SEQUENCE. That is the advantage section 1 describes: in Excel the labels are data. They are not addresses.
That is not a missing function. It is the absence of the thing Improv was built to provide, and it is why the multidimensional tools were invented in the first place.
8. The trust argument, turned around
The popular version of the argument opens on trust: “one of the fundamental issues most users have when using other people’s models. Can I trust it?” It is the right question. But the answer it gives is worth examining, and here the popular version and the refereed one come apart, which is itself informative.
Failure points fall in count and rise in severity. “Reduce potential model failure points to a tiny fraction” is true, and it is about inconsistency: sixty chances for a stray formula become one. What it does not address is logic error, and there the arithmetic reverses. In the old paradigm a wrong assumption in a corkscrew shows up as a visible intermediate you can point at. In the new one it is inside a REDUCE, in one cell, with no intermediates to inspect and no debugger to step with. Fewer things can go wrong; each one that does is harder to find and affects the whole line at once. That is a real trade, and a reasonable one, and the popular piece presents only its first half. The ICAEW, revising its principles for exactly this technology, kept the caution that the enthusiastic version drops.
Excel stays Excel. The popular piece asks why we should care what is inside a library function when we never cared what is inside SUMIFS(). SUMIFS() is one implementation, versioned and shipped with the application. A library of LAMBDA functions is copied into each workbook that uses it, and Layer 7 describes what that costs. The libraries themselves are open, and 5g says so: “under the covers is nothing but Excel formulas.” What does not change is the object. Functional programming and new data structures have been added on top of the grid everyone knows, and a model built with them is still an Excel workbook, which the modeler may have to defend line by line to an audit committee, a lender or a court.
“Need not know anything about LAMBDA” cannot survive contact with a real model. It is true for as long as Depreciateλ does exactly what your fixed-asset policy requires. The first time it does not, because of a mid-year convention it does not implement or a disposal rule it handles differently, the modeler who “need not know anything about LAMBDA” is holding a 600-character functional expression, in a Name Manager text box, with no debugger. The training offered alongside the libraries is the practical answer to that, and it is part of the price.
9. Honest, or a pitch
The two questions have to be answered separately, because the position and its most enthusiastic presentation are not the same object. That separation is the main thing I would want a reader to take away.
The position is honest and largely proven. Dynamic arrays give array-level formulas and eliminate copy-inconsistency by construction. LAMBDA makes recurrences expressible. A generated timeline reshapes a calculation block from two inputs. Component libraries work, are free, and are open to inspection. The strongest statements of all this are in refereed conference papers by people with nothing to sell, corroborated by a professional body that revised its guidance, and grounded in a twenty-year Microsoft Research programme. If you build financial models in Excel, this is the best available way to build them, and the practical advice is good. Anyone who dismisses it as vendor noise has not read it.
And the position is incomplete in a place none of its statements inspects. It closes the first of the six distances, and part of two others. Named dimensions, more than two of them, and layout as a view are not argued against anywhere in this literature. They are not mentioned, and I do not think that is evasion. It is what happens when you improve a paradigm from inside it: the constraint you have never been able to violate stops registering as a constraint. The costs are undiscussed for the same reason. Debugging a spilled model, governing a library across a portfolio of workbooks, nested arrays and thunks, the half-converted model, circularity: each is a live problem and none is a secret. They just do not come up when the question you are asking is how much better can this get.
The new functions take a developer’s skills. Underneath the familiar grid, dynamic arrays and LAMBDA are a pure functional language with no IDE, no module system, no type checker and no debugger, working on a data structure that cannot nest. Using it well is a programmer’s job. A modeler without those skills is better served by a tested third-party package of functions, and the libraries, starter packs and courses exist for that reason. The familiar UI was kept, the familiar model of how the thing works was not, and because the surface did not change nothing warns the next person to open the file.
So: honest, on the evidence. Quiet about what it does not measure, which is the ordinary condition of expert advocacy. The “best of both worlds” is not established, and in its careful statements it is not even claimed; it is a mood the popular version leaves behind. The right correction is narrow. Modern Excel has adopted the formula idea from the multidimensional tools. It has not adopted the data idea, and the data idea is the one the tools were named for.
10. What I take from it
Two things, and the first is not comfortable.
Excel wins on distribution, and that decides most cases. Improv was better and it is dead. Javelin was better and it is dead. A model in modern Excel, built with the discipline this literature prescribes, can be opened by anyone in finance whose Excel is current enough for the functions it uses, on any machine, forever. A model in any multidimensional tool cannot. Any honest comparison has to put that on the table first, because for most working modelers it settles the question before capability is even reached.
But the structural difference is not preference, and it does not go away with skill. Everything in section 6 works, and every layer of it depends on the modeler maintaining something the tool does not know about: that the header row still lines up with the spill, that this workbook’s Corkscrewλ is the repaired one, that the fact table and the report agree. In the Improv lineage those are properties of the engine, so they cannot drift. The distinction is not “powerful versus simple.” It is enforced versus maintained, and maintained things decay at the speed of staff turnover.
That tradition is very much alive. I still teach and work in Quantrix Modeler, which is where these ideas are a shipping product. What I run on this bench is Impromptu, my own research prototype: not a product, not a download, a place where I can open the hood and see what the ideas cost to implement. Writing Gross = Revenue - COGS over a dataset whose dimensions the engine knows by name is, in the end, the same sentence a modeler writes in Excel today as =Revenue - COGS. The difference is entirely in what the engine understands by Revenue: a range that begins at $C$10 and grows right, or an object with axes that have names.
Section 6 was a design, and it has since been built. The leveraged-buyout model of episode one and episode two has been reproduced in fully dynamic Excel, every function written from scratch, with no add-in, on the kind of locked-down install a university or a bank actually gives you. Two numbers from that reproduction bear on this note. Of its 329 defined names, 253, or 77%, exist only to stand in for a dimension the grid has no object for. And its function library is 78 lines of Excel formula, while the machinery that builds the library into a workbook and checks it is 3,804 lines of Python, roughly fifty times as much.
The next post, with a video, applies the same method to the model of Episode 3, which keeps a circular cash policy on purpose. It shows what Excel does with the loop and what the fixed point costs, and its workbooks can be downloaded.
The demo workbook
A small workbook with one sheet for each layer of section 6 can be downloaded: excel-layers-demo.xlsx. Each sheet shows one construction from this note on a toy model, with the formula beside its result. It uses GROUPBY, so it needs Microsoft 365. It contains no macros and needs no add-in. It was built and checked on Excel for Mac (Beta channel) and has not been tested on Windows.
Excel got the array. That was the hard part, and it took the better part of thirty years. The dimension is still outstanding.
Glossary
Dynamic array / spill
A formula that returns many values from a single cell; the results “spill” into the neighbouring cells, which contain no formulas of their own. The spilled range is referenced with the # operator (C10#) and resizes automatically as the result changes shape.
Array-level formula
A formula attached to a whole line item rather than to one cell: one rule (Gross = Revenue - COGS) covering every period it spans. The central idea of the Improv lineage, and the thing dynamic arrays brought to Excel.
LAMBDA
An Excel function that defines a function: LAMBDA(x, y, x + y). Stored in the Name Manager under a name, it becomes callable like a built-in. Combined with the helpers MAP, SCAN, REDUCE, BYROW, BYCOL and MAKEARRAY, it makes Excel formulas a functional programming language. Requires Microsoft 365 or Excel 2024, and not 2019 or 2021.
LET
Names intermediate results inside a single formula (LET(base, A1, g, A2, base*(1+g))), so a long expression can be written once and read.
Functional programming
A way of writing programs as functions that take values and return values without changing anything outside themselves, in which a function is itself a value that can be passed to another function. In Excel, LAMBDA and the functions that take one as an argument (MAP, BYROW, SCAN, REDUCE, MAKEARRAY); see section 2.
Corkscrew
The financial-modeling roll-forward: closing = opening + additions − disposals, with each period’s opening equal to the previous period’s closing. Traditionally a block of ordinary cells; the calculation shape dynamic arrays could not express before LAMBDA.
Nested array / #CALC! / thunk
In Excel as it ships today a value cannot itself be an array, so a formula that would build an array of arrays returns #CALC!. A preview in Microsoft’s Beta channel (September 2026) lifts this in workbooks switched to Compatibility Version 3. The community workaround is a thunk: each intermediate array is wrapped in a zero-argument LAMBDA, so the accumulator holds functions, which are legal values, rather than arrays, which are not, and they are unwrapped and recombined at the end. REDUCE’s accumulator may be one flat array, which is what a fixed point carries; SCAN’s must be a single value, because SCAN returns one value per step.
GROUPBY / PIVOTBY
Functions added in 2024 that summarise a table by one dimension (GROUPBY) or cross-tabulate it by two (PIVOTBY), returning a spilled report from a formula rather than from a PivotTable object. Microsoft 365 only.
TRIMRANGE / trim references
A 2024–25 addition that strips blank rows and columns from a range’s edges, with a shorthand “dot” syntax on the range operator (A2:.A100). It exists because dynamic-array models routinely reference more range than they use.
Excel Data Model / Power Pivot / DAX
Excel’s genuinely multidimensional engine: named dimension tables and named measures, written in the DAX language, pivotable without touching the definitions. It satisfies most of the Improv properties, but it aggregates facts that already exist, and is not where forecasts get built.
Structured reference
A Table-based reference by name, Assumptions[Growth] rather than $B$7:$B$66, that follows the column as the table grows.
Iterative calculation
Excel’s setting that permits circular references and resolves them by repeated recalculation, until a fixed number of iterations is reached or the largest change falls below a set amount (by default 100 and 0.001). It is a setting of the application rather than of the workbook, so one switch governs every open workbook. It does reach spilled dynamic arrays (Layer 5).
Fixed point
A value a calculation returns unchanged: an x with step(x) = x. A circular model is solved by finding one, starting from a guess and applying the model to its own output until the change falls below a tolerance. Impromptu does this itself for a loop that runs across datasets; in dynamic-array Excel it is written with REDUCE (Layer 5).
5g
Craig Hatmaker’s standard and function library, which packages dynamic-array modeling logic into named LAMBDA functions (Corkscrewλ(), Movementλ(), Depreciateλ()) so that modelers can use them without writing LAMBDA themselves. One of several such collections; referred to here as a representative example rather than as a recommendation.
Named dimension
An axis of a model that the engine knows by name, with named coordinates along it (period: 2026, 2027…; product: A, B, C). Formulas address it by label, views project it, and adding a coordinate extends every rule that spans it. Excel’s grid has no such object; the Improv lineage is built on it.
Sources & links
The position, in its refereed form
- Peter Bartholomew, A Structured Approach to the development of Solutions in Excel (EuSpRIG 2016) — named formulas as a readable, quasi-procedural notation.
- Peter Bartholomew, Will Dynamic Arrays finally change the way Models are built? (EuSpRIG 2019).
- Peter Bartholomew, Excel as a Turing-complete Functional Programming Environment (EuSpRIG 2023).
- Craig Hatmaker, Reducing Errors in Excel Models with Component-Based Software Engineering (EuSpRIG
- — the component-library argument, made properly.
- The EuSpRIG conference proceedings, which are the closest thing this field has to a literature.
The position, in its popular form
- Model Citizn with Craig Hatmaker, LAMBDA — The New Excel Paradigm for Modeling (13 March 2024). The quotations in sections 3 and 8 are from this piece.
- 5gModeling.com — the standard and the free function libraries; the Financial Starter Pack on Eloquens; the Financial Modelling with Modern Excel bootcamp.
- Liam Bastick, Financial Modelling using Dynamic Arrays: Let Lambdas Extend Your Range (Holy Macro! Books, 2024) — a book-length worked treatment of the same techniques, from a different quarter.
Microsoft’s own account of why LAMBDA exists
- Simon Peyton Jones, Margaret Burnett and Alan Blackwell, A user-centred approach to functions in Excel (ICFP 2003) — the research LAMBDA descends from, eighteen years before it shipped.
- Microsoft Research, Calc Intelligence — the programme, and LAMBDA: the ultimate Excel worksheet function by Andy Gordon and Simon Peyton Jones.
- Microsoft Research podcast, Advancing Excel as a programming language.
What the profession says
- ICAEW, Twenty principles for good spreadsheet practice, 2024 edition — revised for dynamic arrays and LAMBDA, and still cautious.
- ICAEW, Spreadsheet competency framework.
- The FAST Standard and the Operis approach — named-formula modeling as established practice long before LAMBDA.
Excel mechanics
- Microsoft, LAMBDA function — including that names are saved in the workbook, not in Excel.
- Microsoft, How to correct a
#CALC!error — nested arrays are not supported. - Microsoft 365 Insider blog, Put multiple values in one cell with lists and arrays in Excel — the Beta-channel preview of nested arrays, September 2026.
- A worked thunk-based binary-tree accumulator for returning arrays of arrays.
- Microsoft, Announcing GROUPBY and PIVOTBY and TRIMRANGE.
- Microsoft, LAMBDA recursion limits — the operand stack caps recursion at roughly 1024 ÷ (parameters + 1).
- Excel Labs, the Microsoft Garage add-in that absorbed the Advanced Formula Environment — multi-line LAMBDA editing, still a preview; and the standing request for a VS Code extension.
- XlsxWriter, writing a LAMBDA as a defined name — the
_xlfn./_xlpm.prefixes that make a library buildable from outside Excel. - xlwings, What makes Excel’s LAMBDA functions so awesome (and what doesn’t) — a clear statement of the cross-workbook reuse problem.
The lineage
- Javelin (1985), Trapeze (1987), Lotus Improv
- — data, formulas and views as separate things.
- Quantrix Modeler — where the tradition ships today.
- Impromptu under the hood — the research bench this note is written from, and what its formula engine does with named dimensions.